StreamScore
Email Performance Dashboard
Overview
I lead the experience design of the StreamScore. An analytics product designed to track and score email performance for bulk senders
Role
Sole UX/Product Designer
Working with a Team of 5+ Developers , QA , Product Manager, and Marketing team of 4
Tools: Axure, Figma, Jira, Confluence, Slack, HotJar, Google Analytics, Adobe, UserResearch.com
Approach
Agile, 4 Sprints, UX a head of sprints,
Graphic Design and Screenshots for Marketing Campaign Roll outs
Problem
Compared to competitors, SocketLabs did not offer a robust way to score and communicate email health

“Anticipate email deliverability issues before the problem happens.”
Strategy:
Create a one-stop shop to see my entire email deliverability status.
Provide opportunities for users to drill down and solve deliverability problems ie: failed delivery, wrong emails etc. Update the look and feel to use in Product Marketing Material
Email Expert
Role: Marketing or CRM team member
Profile: Understands email delivery from a content and engagement perspective
Goals: Monitor engagement and inbox placement
“Who needs to track and send bulk email?“
Audience
To ground our design decisions in real user needs, I collaborated with Marketing, Support, and Sales teams to identify key user types through first-hand interviews and subject matter expert input. This discovery process led to the definition of two primary personas:
1. System Admin
Role: Infrastructure/IT team member
Profile:Deep technical knowledge of email systems and server-side delivery processes
Goals:Quickly identify and resolve delivery issues

“The Email ecosystem is more complicated than I thought?”
Conceptual Mapping: Visualizing the Deliverability Ecosystem
To make sense of the Email deliverability ecosystem and guide dashboard design decisions, I created a conceptual map that visualizes how these components relate to one another and how data flows to the end user.
The connection between sending servers and associated sending domains
How inbox providers (e.g., Gmail, Outlook, Yahoo) evaluate incoming mail
The types of data extracted during this process—such as bounce codes, engagement signals, and authentication results (SPF, DKIM, DMARC)
How these metrics feed into SocketLabs tools like StreamScore and populate the Dashboard
This approach ensured that users could clearly understand where issues originate and how to take action across different layers of the email infrastructure.
“How does this product stand out in delivrability landscape?”
“Who is doing something similar?”
How do we compete?
User Story Mapping for Email Score Alert System
Mapping the user story allows us to frame the project within the context of real user behavior. By visualizing the steps users take—and pairing them with potential supporting features—we can prioritize functionality, identify pain points, and guide our sprint planning with clarity.
Comp Analysis Positioning the Stream Score in the current landscape
I identified a major gap between deep technical diagnostics and the lack of a high-level, at-a-glance view for monitoring overall performance. While competitors focused on granular data, few offered proactive summaries or visual cues that surfaced emerging issues ike drops in engagement, rising spam complaints, or deliverability risks—before they impacted revenue. .
“How should I display the StreamScore and invite interaction?”
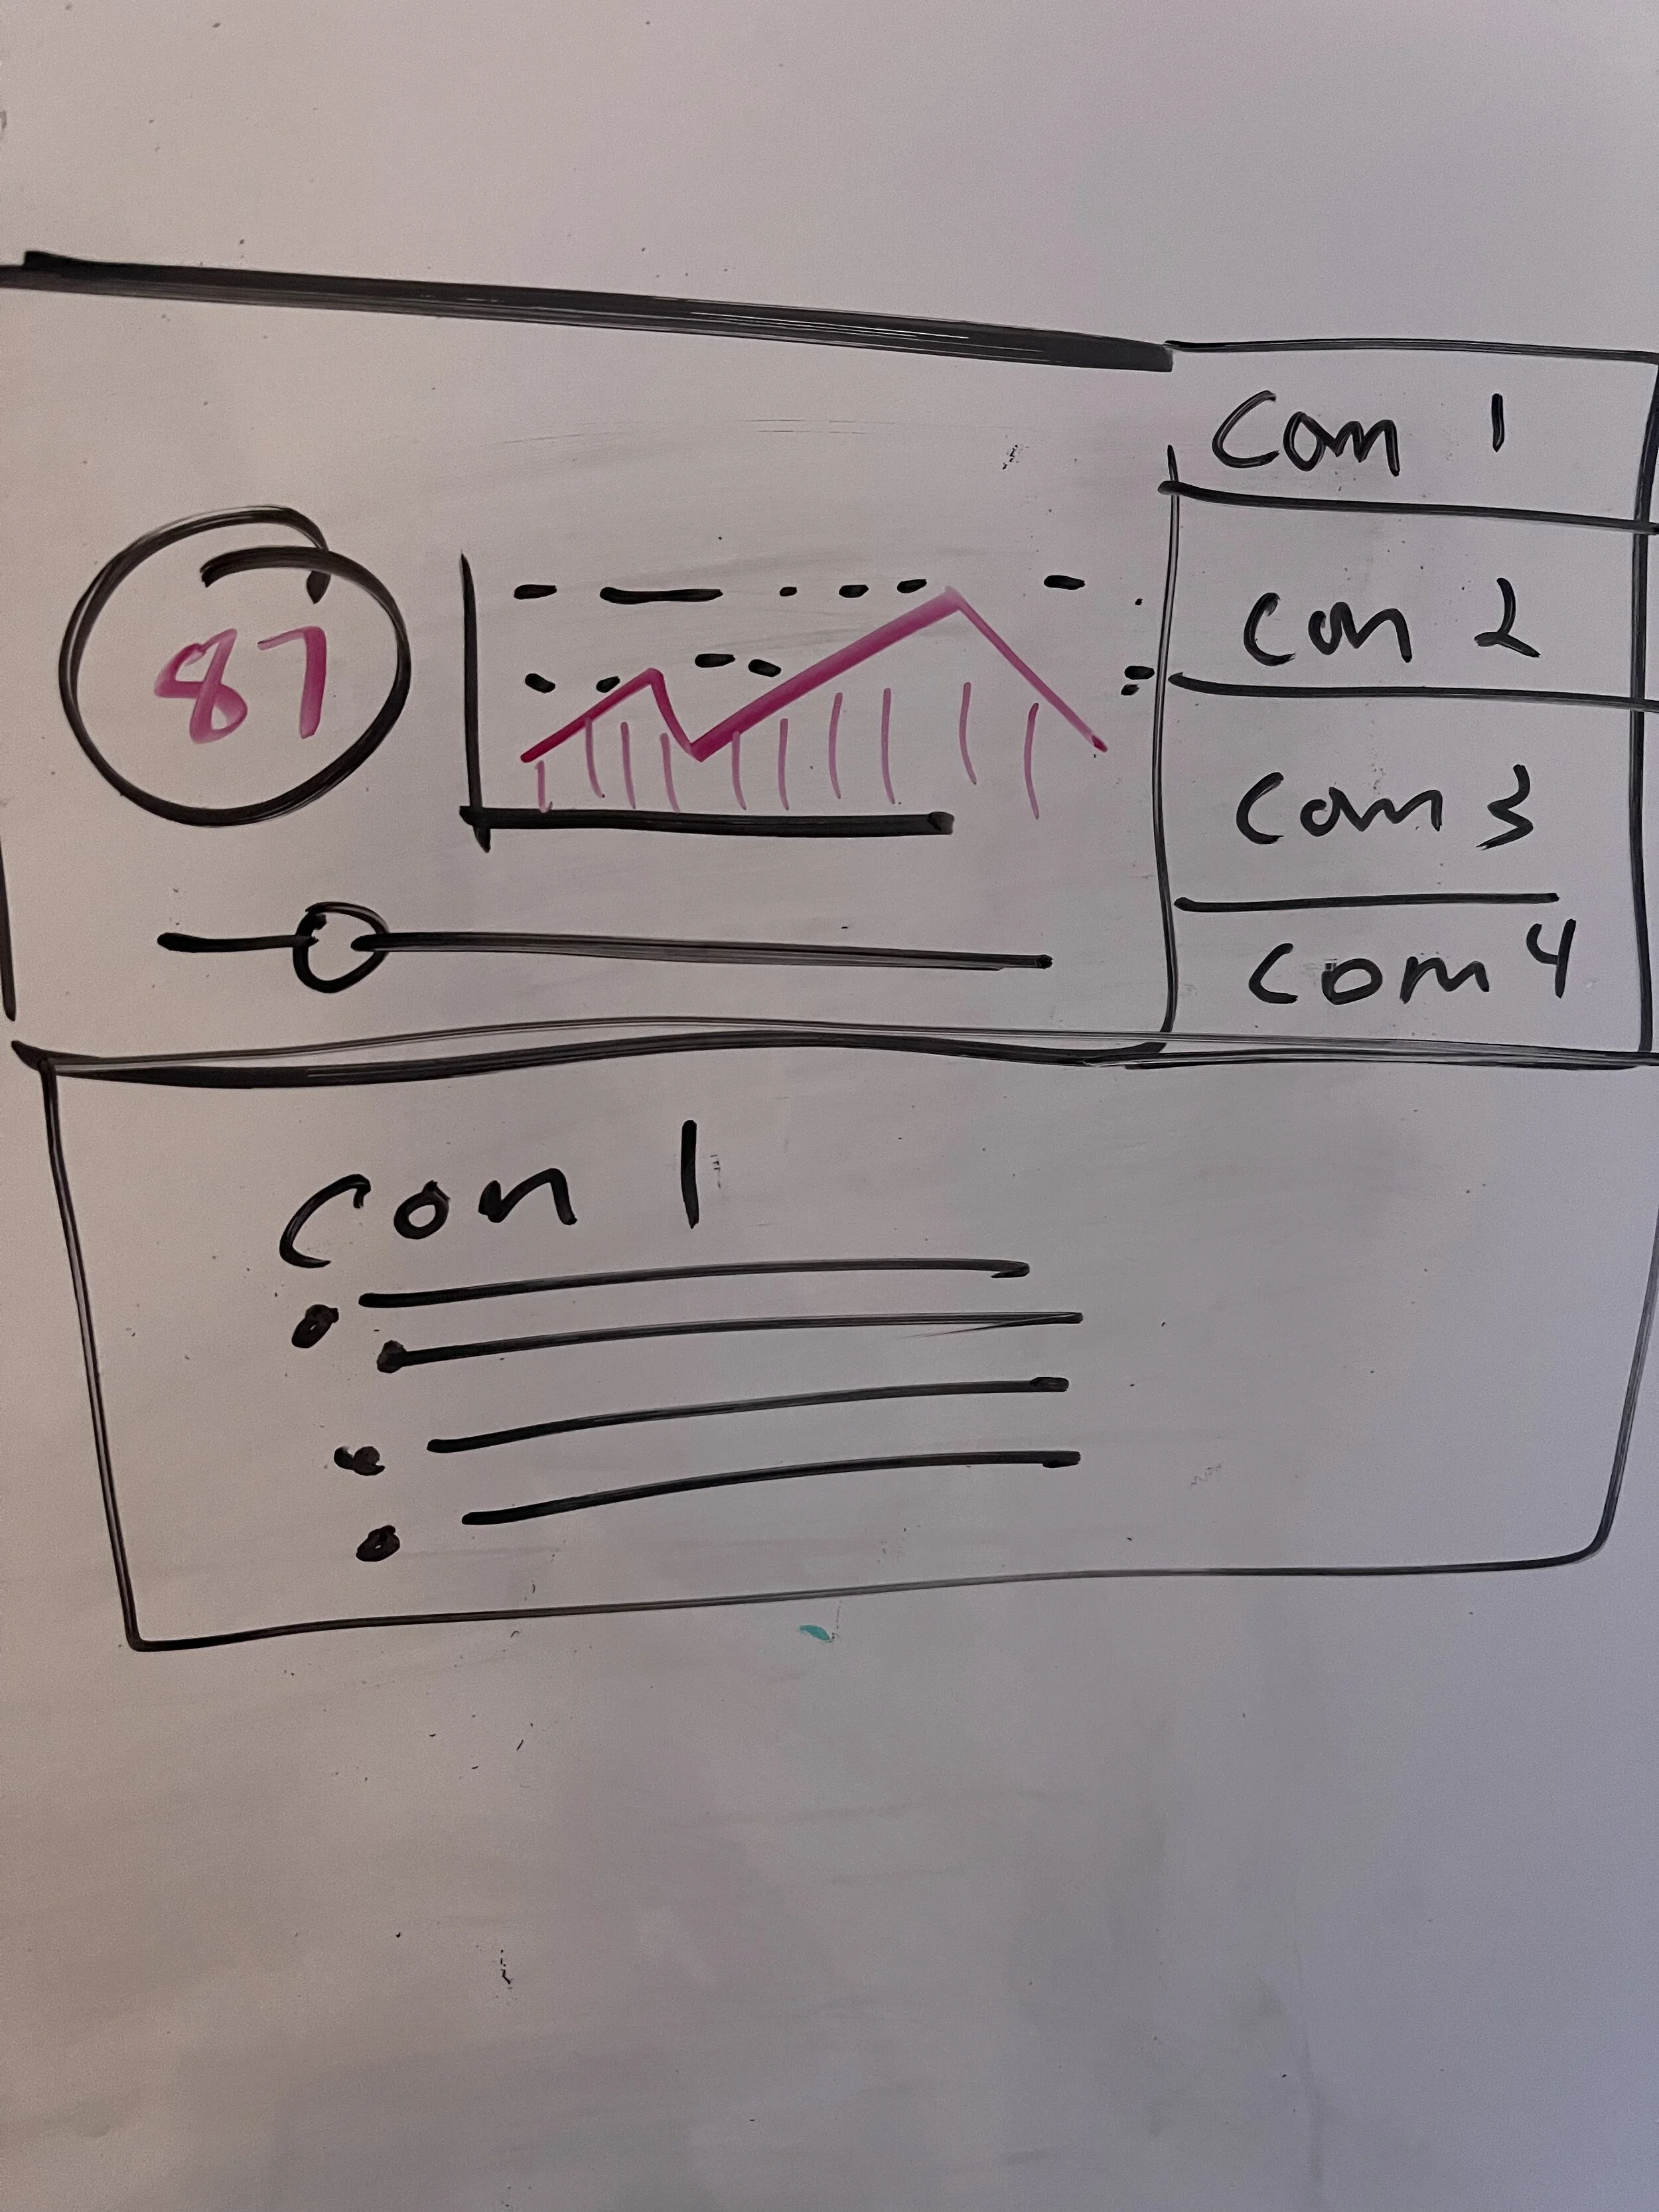
Ideation Sketches. Data Visualization Drill down flow
These concepts visualize how each domain contributes to the overall score, highlighting critical metrics such as bounce rates, authentication failures (SPF, DKIM, DMARC), and blacklist status.
The goal was to surface domain-specific patterns and anomalies quickly—enabling users to pinpoint underperforming senders or configurations. Each sketch emphasizes clarity, with modular components for trend graphs, status indicators, and guided recommendations.

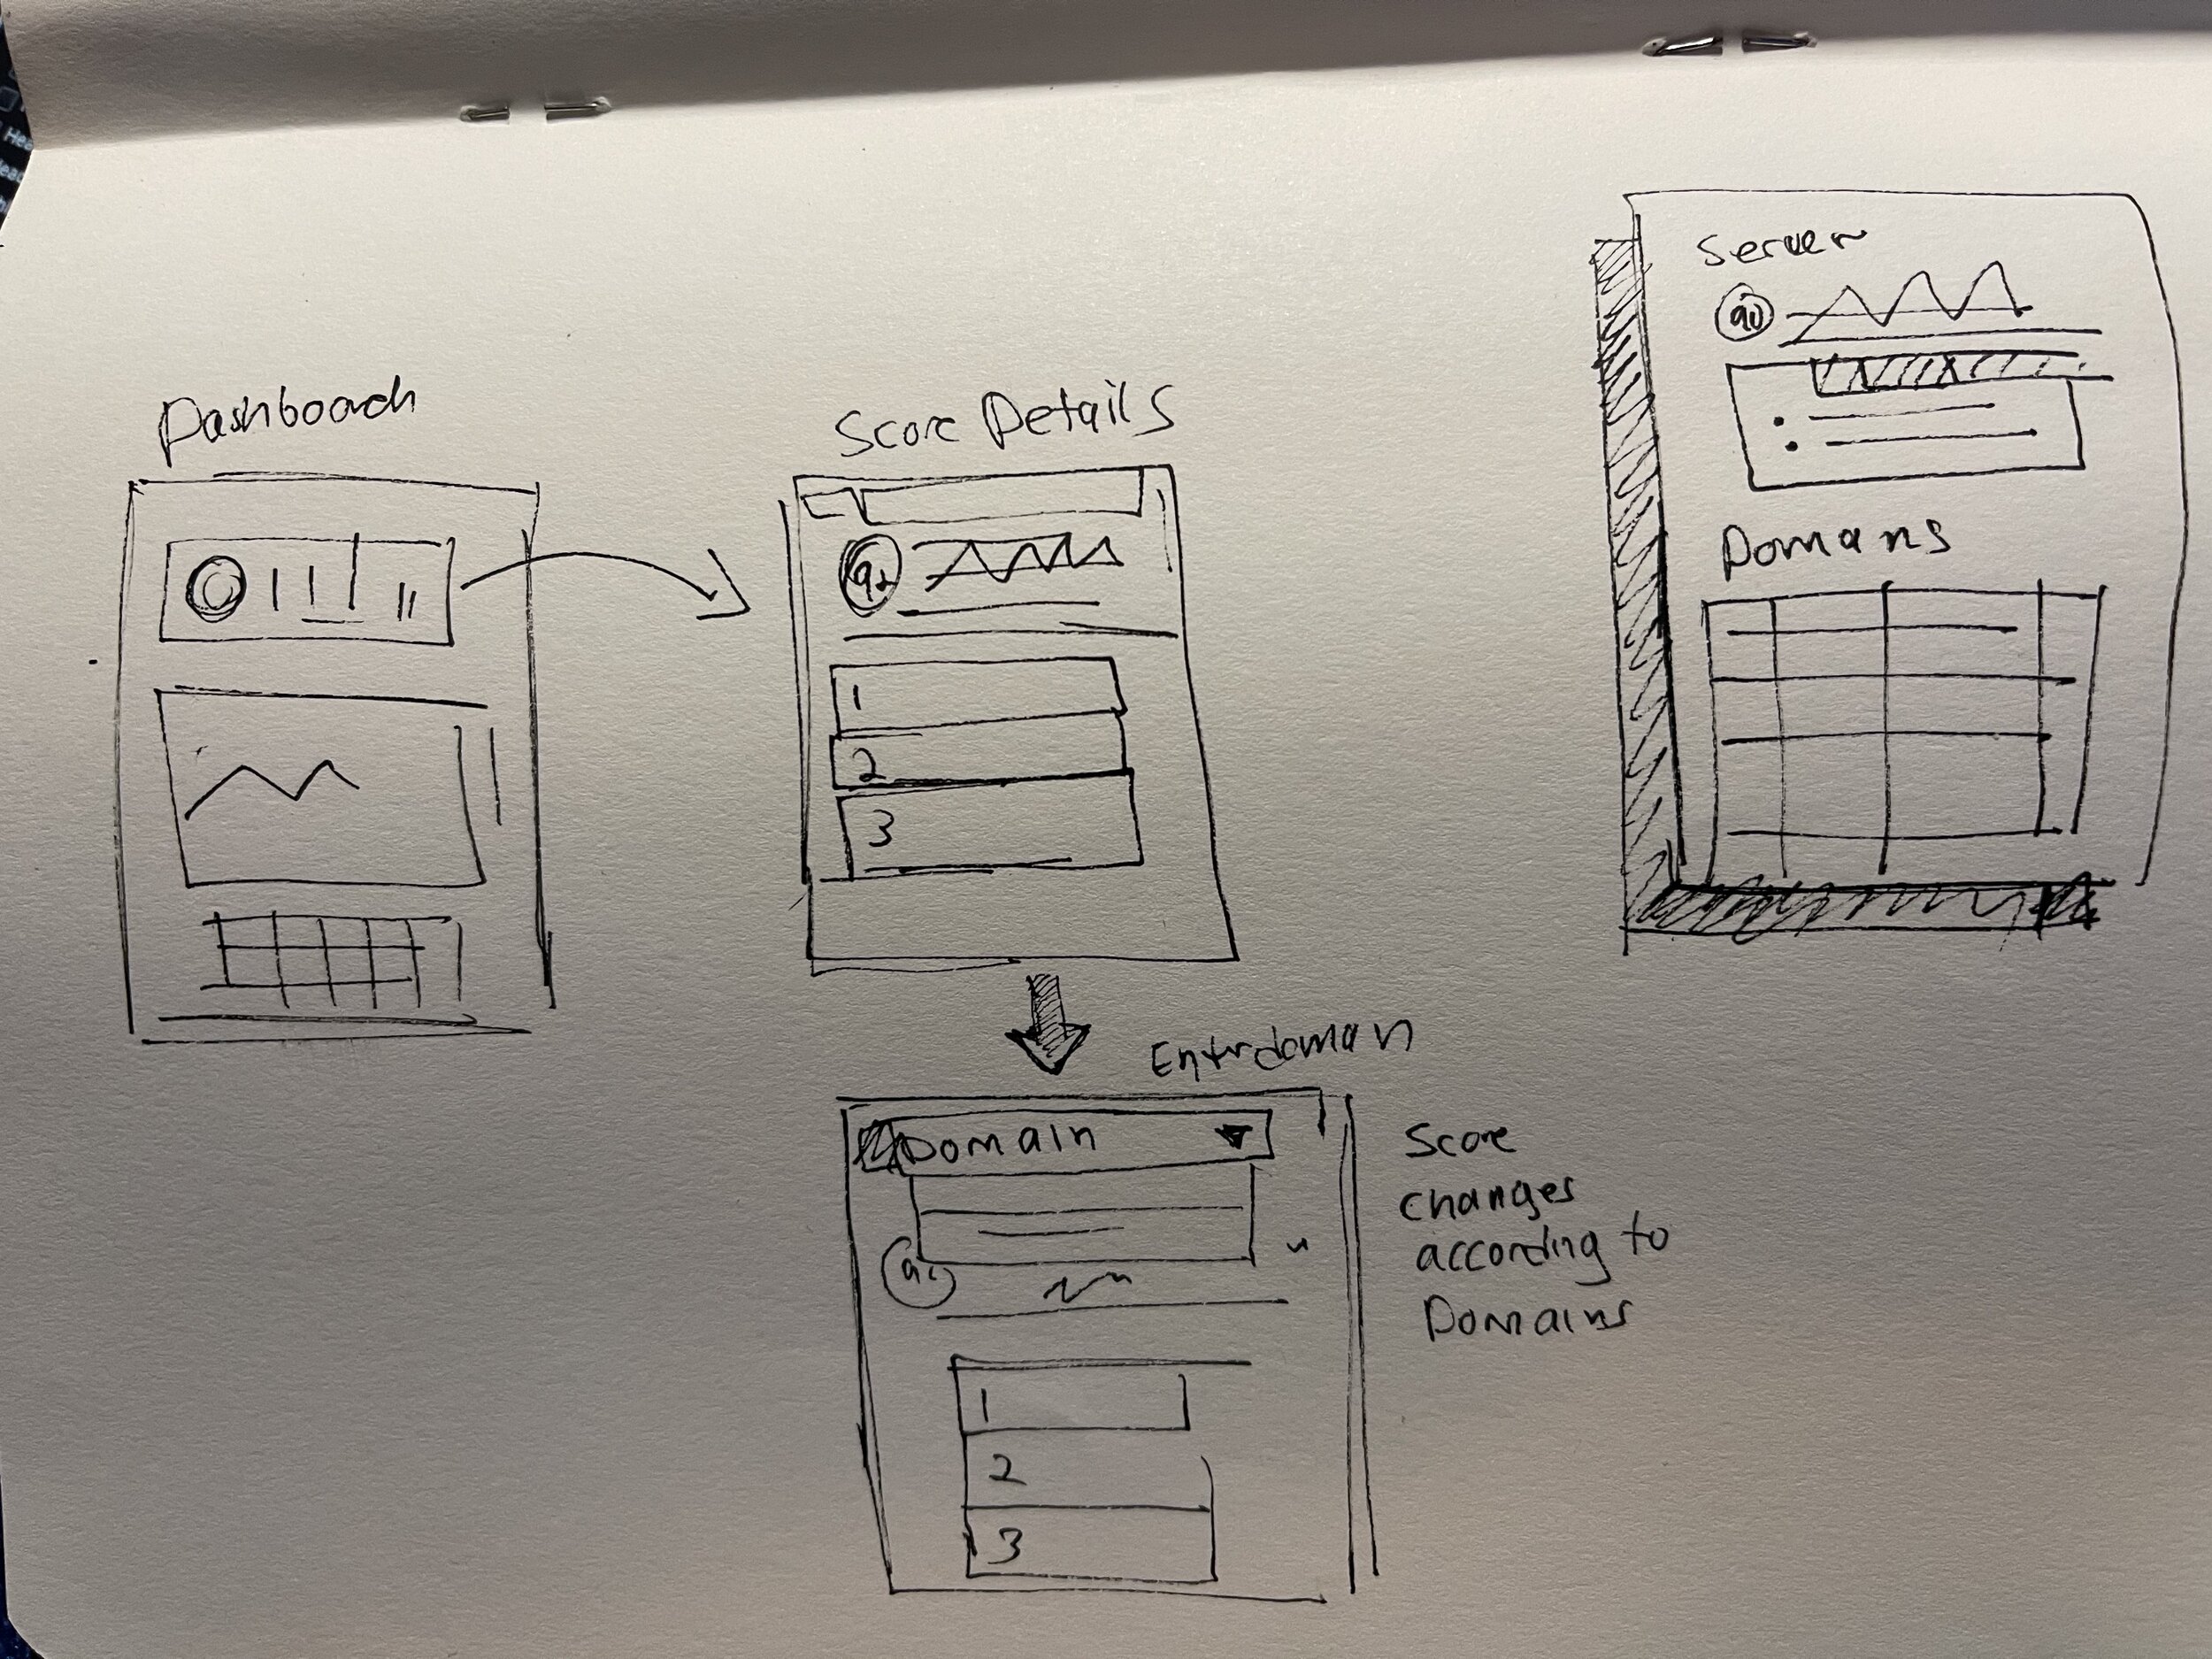
The ‘drill-down problem sovling pattern’ needs to be consistent and easily accessible.
Wire Flow: From High-Level Trends to Domain-Level Diagnostics
A core user behavior we needed to support was the ability to monitor email performance across multiple sending domains.
The flow begins with a global view of deliverability scores, helping users quickly identify which domains are underperforming. From there, users can drill down into individual domains to view specific performance metrics such as bounce rates, spam complaints, authentication failures, and blacklist status.
User Needs Addressed.
Spotting trends across all domains at scale
Investigating performance dips per domain
Pinpointing issues down to the exact date and time
Taking corrective action based on specific failure types
Wireframes: Modular Dashboard for Email & Account Visibility
The dashboard is composed of modular components that surface key aspects of both email performance and account status. Designed as a centralized hub, it acts as a one-stop-shop where users can quickly assess deliverability metrics, authentication health (SPF/DKIM/DMARC), blacklisting alerts, and overall score trends across multiple sending domains.
Beyond providing visibility, it offers direct pathways to troubleshoot issues, explore domain-specific data, and take corrective action.
“This product is going to market upon release, it has to look fresh.”
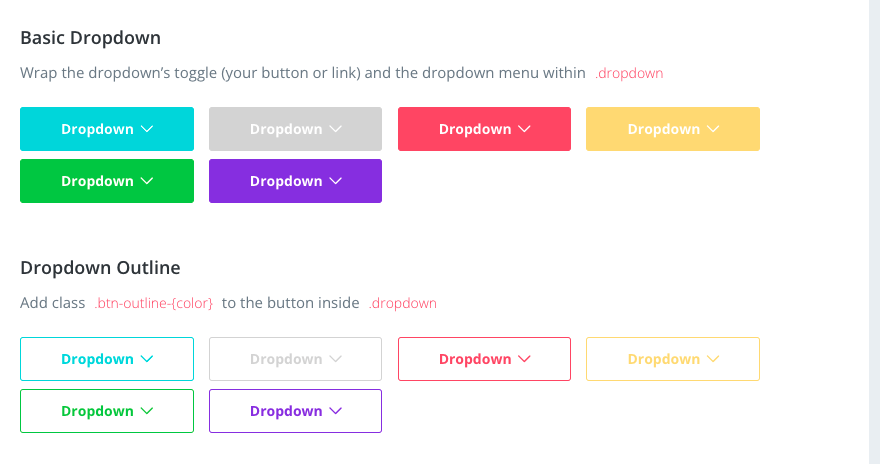
Visual Design Enhancement & Brand Alignment
As part of the broader initiative, we also focused on elevating the visual design to ensure consistency with the SocketLabs brand. We began by selecting a flexible design template that supported modern UI patterns and scalable components. From there, we customized the layout, color palette, typography, and iconography to align with SocketLabs' visual identity.
In addition to adhering to brand standards, we ensured that the new styles harmonized with existing design system patterns—maintaining continuity across the platform while introducing a more refined and user-friendly aesthetic. This effort helped unify the interface and reinforce brand trust across all


Server Setup Status Bar Design
The status bar gives users a clear view of their onboarding progress across four key steps: signing up, sending a first email, setting up authentication, and enabling click-tracking analytics. By visualizing these steps together, the bar helps users track their progress, understand what’s left to complete, and build confidence that their server is fully ready for reliable sending.
Server Details Design Deliverability Status
The Server Stats component surfaces critical account metrics — API calls, billing period, and bandwidth usage — each paired with an intuitive gauge. This design gives users an immediate sense of their system’s performance and resource consumption, helping them anticipate limits before they impact deliverability or incur extra costs. By turning complex usage data into simple visual gauges, the dashboard empowers users to monitor server health at a glance and take proactive action when needed.
“Setup your server fro the best email deliverability.”
“Measure the effectiveness of each email campaign.”
“Provide a snapshot of all accounts and email performance.”
Per-Mailing Performance Table
The performance table provides a detailed breakdown of each mailing, including delivery rates, failures, opens, clicks, complaints, and unsubscribes. With filtering options by day, hour, ISP, or sending domain, users can drill into specific segments to identify trends and issues. By surfacing both engagement and deliverability metrics side by side, the table empowers users to measure campaign effectiveness, troubleshoot problems, and make data-driven improvements.
“Provide data on all email metrics (clicks, opens etc.)”
The StreamScore widget gives users a clear view of email health over the last 30 days, combining an overall score, trend line, and domain-level details. By surfacing key metrics like authentication status, week-over-week and day-over-day changes, it helps users quickly gauge deliverability performance and take action to keep campaigns on track.
Performance by Date Range Design
This component lets users define a start and end date to view engagement metrics—such as clicks, opens, and deliveries—within a chosen timeframe. By adjusting the range, users can analyze short-term campaign results or long-term trends, making it easier to measure impact, compare performance, and optimize future sends.
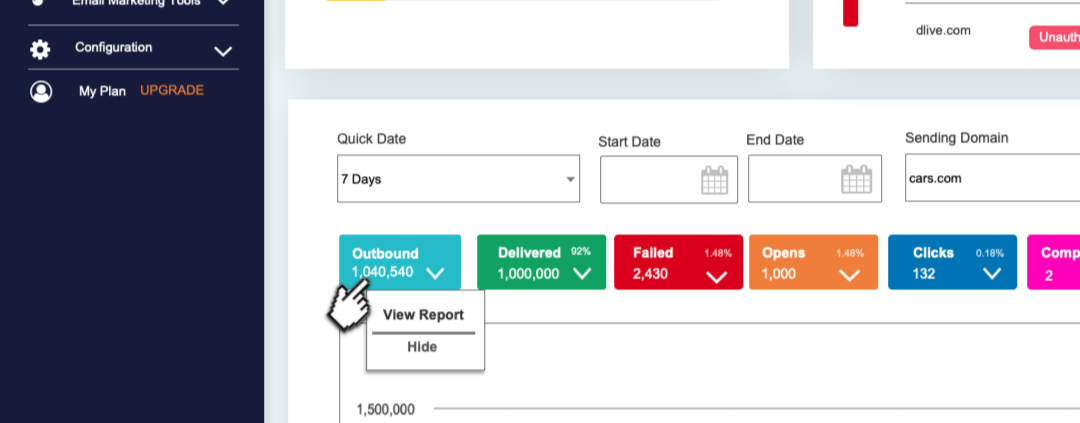
“Take action based on the score”
View Reporting, from the dashboard, click to view a more detailed breakdown of each metric
The Big P. I designed a system where users can start with a high-level score—representing overall email health—and drill down into specific focus areas, such as engagement performance.
Within the engagement view, users can explore how open rates, click-throughs, and interaction patterns directly impact their overall email performance. This level of visibility helps both technical and marketing-focused users understand not just what is happening, but why it’s happening—empowering them to take informed action before problems escalate.
“A look under the hood: Diagnostics.”
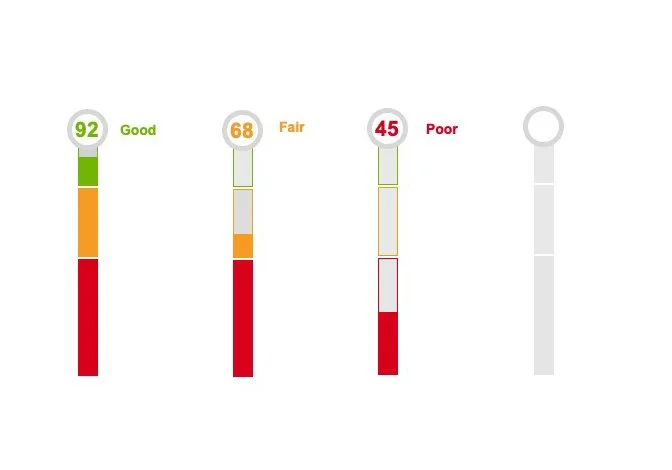
The StreamScore widget gives users a quick read on email health with a red–yellow–green gauge, a 30-day trend line, and domain-level details. Clicking StreamScore Details opens a deeper breakdown of contributing factors—such as audience, engagement, and reputation scores—so users can move seamlessly from a high-level view to actionable insights that keep campaigns on track.
“Helping users understand not just their current status, but how each element contributes to the overall score.”
Score Trickledown: Server-to-Domain Visibility Drawer
Introduced a drawer component within the UI that users can open to view a timeline of outgoing email performance across domains. This drill-down capability empowers users to diagnose problems more effectively, trace them back to their source, and prioritize which domains may require attention first—all within a seamless, intuitive interaction pattern.
Build trust through transparency.
That meant not only visualizing the score itself, but also clearly communicating how it’s formulated and what underlying metrics influence it. Audience health quality, invalid addresses, and complaint rates. Engagement. Open and click-through rates, reply behavior, and time spent reading. Reputation – Historical sending behavior, spam complaints, and blocklist status. Security – Protocols like SPF, DKIM, and DMARC that verify sender identity
The StreamScore interface breaks this complexity down into digestible components, helping users understand not just their current status, but how each element contributes to the overall score.

Conclusion: Bridging Deliverability and Engagement
Overall, the redesigned dashboard successfully supported the needs of both primary personas—System Admins and Email Experts—by delivering clear, actionable insights across technical performance and marketing engagement.
By surfacing real-time deliverability metrics alongside user-friendly engagement data, the experience empowered users to not only troubleshoot infrastructure issues, but also optimize email campaigns proactively. The integration of StreamScore, domain-level drilldowns, and visual alerts helped close the gap between technical complexity and strategic decision-making—turning the dashboard into a true command center for email health.
This project demonstrates the impact of UX thinking when applied to deeply technical products: when clarity, hierarchy, and transparency are prioritized, even complex systems become approachable and effective.